

Your utility bill isn't just an invoice; it's a structural leak in your balance sheet. Right now, a significant chunk of what you pay is just funding utility wildfire mitigation instead of your own growth. It's exhausting to watch up to 24% of your bill go toward their insurance costs while your own margins get squeezed by those 19.42¢/kWh average rates. If you've ever thought, "I need to analyze my business energy consumption," but didn't know where to start, you're in the right place. You've felt the pressure to go green, but without a clear financial roadmap, it often feels like another expense you can't justify yet.
I get it. Staring at complex Time-of-Use structures and sky-high demand charges makes it feel like the game is rigged. But you don't have to keep guessing where your overhead goes. We're going to skip the marketing fluff and look at the exact steps to audit your facility's footprint for maximum ROI. I'll show you how to use your 15-minute interval data to build a prioritized list of energy-saving goals, specifically looking at whether a BESS or a solar carport investment actually pencils out for your bottom line.
Key Takeaways
- Most people look at the bottom line of the bill, but the real financial damage is buried in the "peak" windows where California utilities hammer you with demand charges.
- You can't fix what you haven't measured; start by pulling 12 months of interval data to precisely analyze your business's energy usage.
- Identifying your building's baseload is the fastest way to spot waste, since it's the energy your facility "breathes" even when nobody is on the clock.
- Strategic infrastructure like a BESS or a rooftop solar system shouldn't be a shot in the dark; use your data to size a system that targets your specific ROI goals.
- Flipping a parking lot from a liability into an asset is possible once you evaluate how a solar carport can offset operational costs and generate long-term value.
Decoding the California Utility Bill: Where Your Money Actually Goes
If you're staring at your PG&E bill and wondering why the total keeps climbing despite your best efforts, you aren't alone. Most commercial property owners focus strictly on the total kilowatt-hours (kWh) used, but that is only half the story. To truly analyze my business energy consumption, you have to look past the volume and look at the velocity. In California, your bill is split into two distinct, often unequal parts: consumption and demand. One is about how much you use; the other is about how fast you use it.
Consumption vs. Demand: The Hidden Cost of Spikes
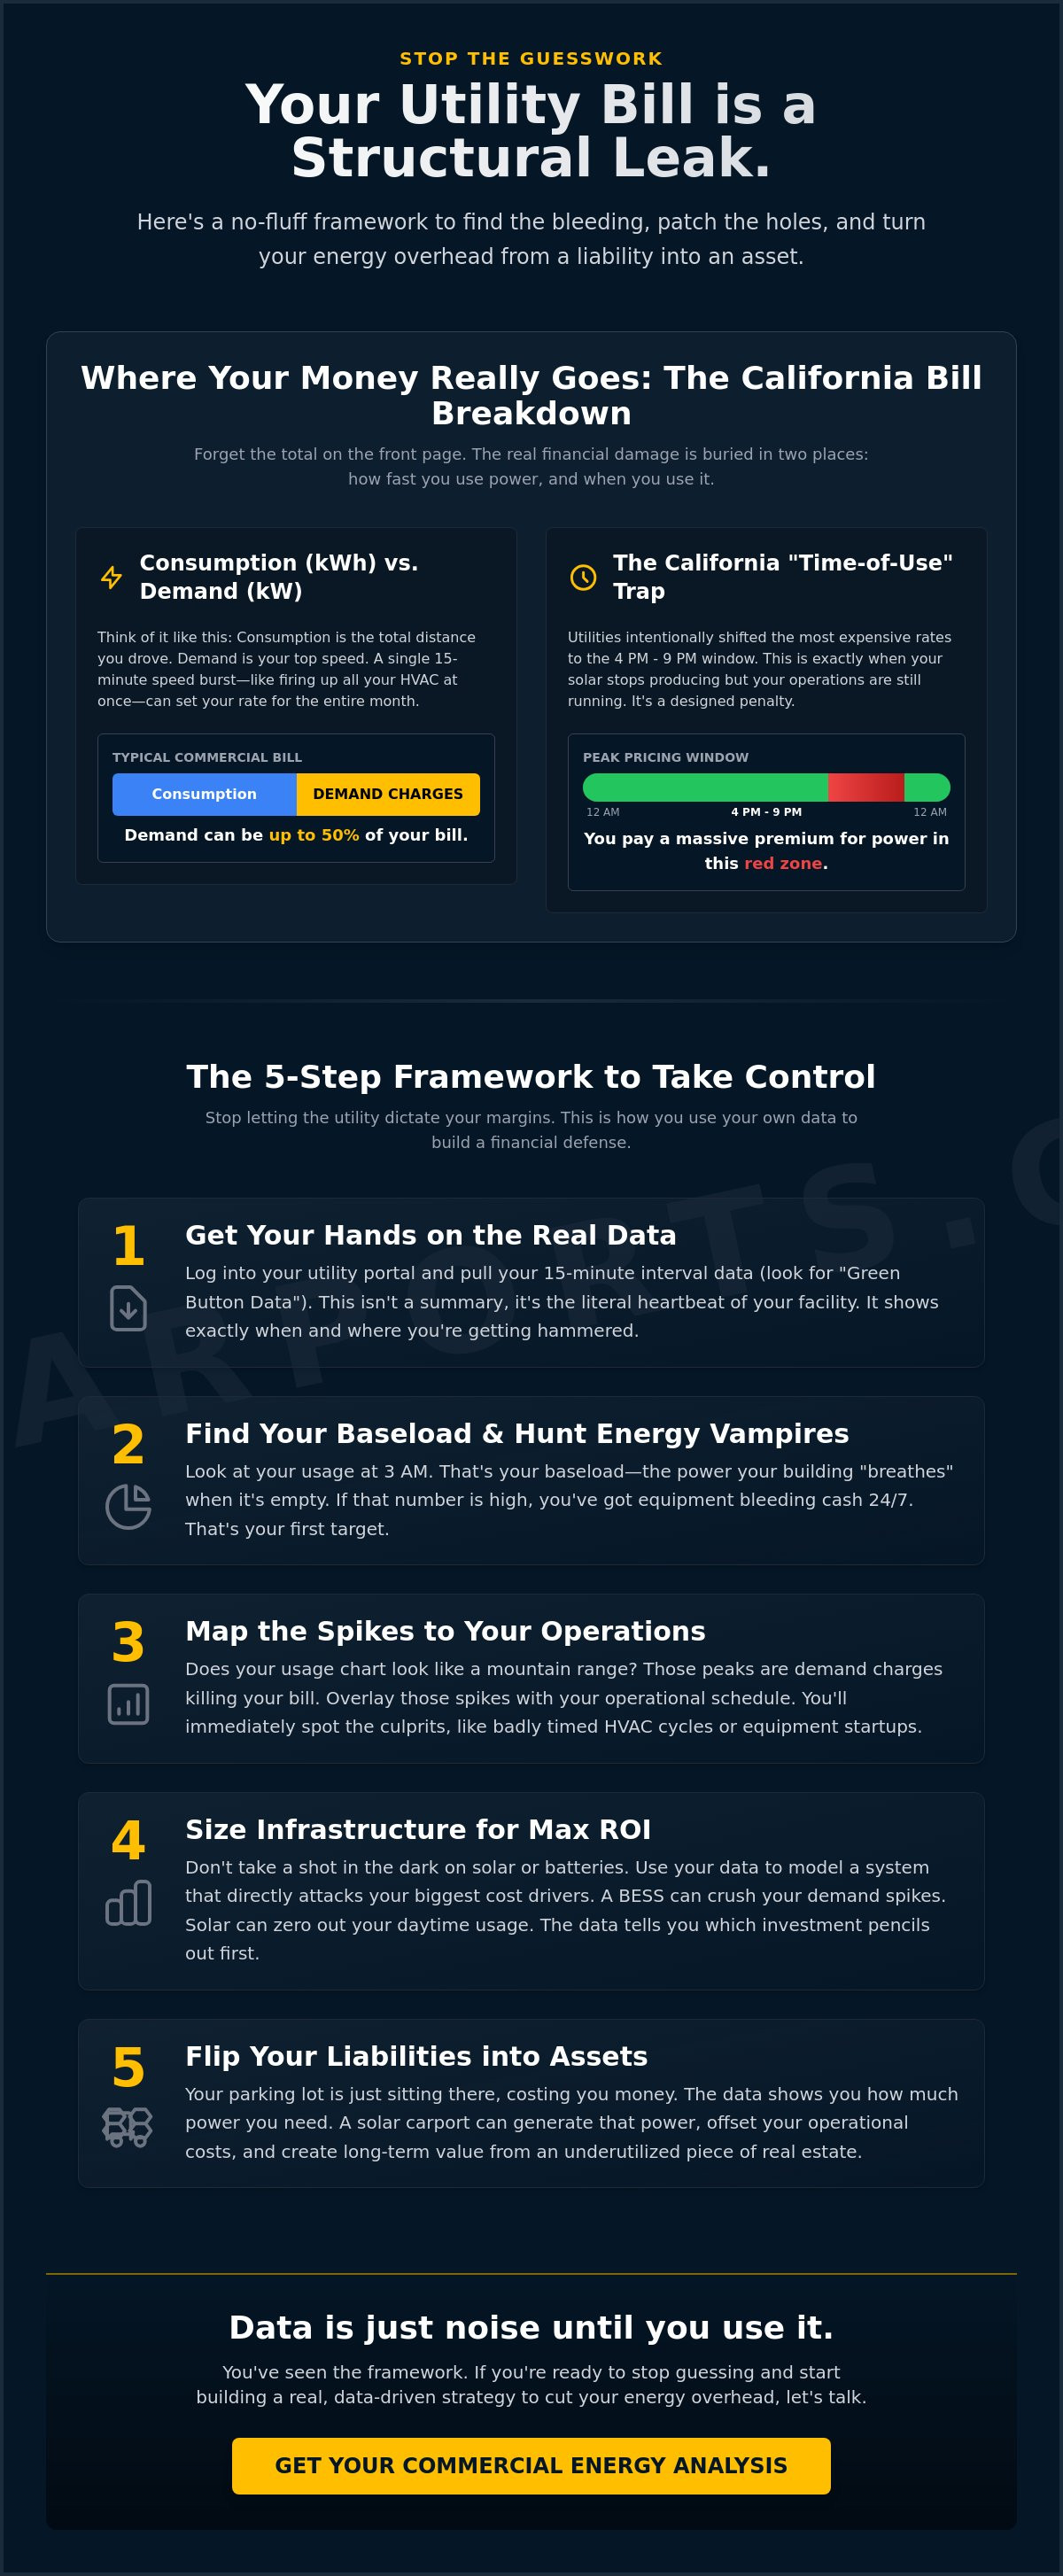
Think of consumption as the total distance you drove. Demand is how fast you were going at your peak. In the broader context of U.S. energy consumption, commercial buildings are unique because they require massive amounts of power all at once. That is where demand charges (kW) come in. This line item is essentially a "toll" the utility charges for maintaining the infrastructure to handle your building's maximum draw. It's not uncommon for demand charges to account for 50% of a California commercial bill. The kicker? A single 15-minute spike, perhaps from starting up heavy HVAC units simultaneously on a hot Tuesday, can set your demand rate for the entire month. Your goal is a high load factor, which means your energy use is steady rather than erratic.
The California TOU Trap
California utilities have some of the most aggressive Time-of-Use (TOU) schedules in the country. They've shifted the most expensive windows to the evening, typically 4 PM to 9 PM, precisely when solar production drops off but business operations are still humming. This isn't an accident. It's a designed penalty for standard commercial operations. Even if you already have traditional solar, the current "Net Billing" environment means you're getting pennies for what you export while paying a premium during those evening hours. If you don't account for these windows when you analyze my business energy consumption, your "green" investment will never reach its full financial potential. You're essentially paying for the grid's inefficiency while your own margins suffer.
A 5-Step Framework to Analyze Your Business Energy Consumption
You don't need a complex software suite to find where the money is leaking. You just need your own data and the right lens. When I sit down to analyze my business energy consumption, I start by stripping away the noise to find the building's actual behavior. In Northern California, where PG&E rates are some of the highest in the country, this isn't just a math exercise; it's a defensive necessity for your bottom line.
Step 1: Accessing Your Interval Data
Log into your PG&E portal and look for the raw 15-minute interval data. Green Button Data is the industry standard for energy transparency that lets you download this usage history in a format you can actually work with. This isn't just a summary of what you owe. It's the literal heartbeat of your facility captured in real time, showing exactly when your draw hits the red zone during those expensive afternoon windows.
Step 2: Identifying Your Baseload and Peaks
Check the usage at 3 AM. That is your baseload; it is the energy your building "breathes" while the staff is home and the lights are off. If that number is high, you have equipment "vampires" like outdated motor controllers or server rooms running without optimized cooling. Visualize your load profile. If it looks like a jagged mountain range of spikes rather than a flat plateau, you're getting hammered by demand charges.
Map those spikes against your actual production or HVAC schedules. You'll find the "low-hanging fruit" like outdated lighting or poorly timed chillers almost immediately. To see where you truly stand, compare your results to the Commercial Buildings Energy Consumption Survey (CBECS) regional benchmarks. If you want to stop guessing and start fixing, a commercial property energy cost saving analysis can translate these raw numbers into a clear investment strategy.
Turning Data into ROI: From Analysis to Infrastructure
Data is just noise until you use it to build something. Once you've gone through the effort to analyze my business energy consumption, the next move is about capital allocation. You're looking for the highest return on every dollar spent to stop the utility from raiding your margins. In California, this usually means moving beyond simple conservation and toward onsite infrastructure that gives you control. It's about changing the physical reality of how your building interacts with the grid.
The financial math here is actually quite aggressive right now. If you move before the "Safe Harbor" deadline of July 4, 2026, you can secure a 30% federal investment tax credit (ITC) for solar and storage projects. Combined with 100% federal bonus depreciation available in 2026, the payback period for these assets has dropped significantly. You should also check if your property falls under the California Building Energy Benchmarking Program, as staying compliant often reveals the exact data points needed to justify these upgrades to stakeholders.
Why BESS is the Secret Weapon for California Businesses
Batteries aren't just for backup; they're for "peak shaving." Remember those 50% demand charges we talked about? A Battery Energy Storage System (BESS) watches your building's draw in real time. When it sees a spike coming, the battery kicks in to cover the load so the utility meter never sees the surge. It's a way to artificially flatten your load profile. If you're in a territory like Central Coast Community Energy, you might even qualify for rebates between $300/kWh and $500/kWh, which further accelerates your ROI.
The Strategic Advantage of Solar Carports
If your rooftop is cluttered with HVAC units or lacks structural integrity, look at your parking lot. Solar carports turn underutilized asphalt into a power plant while providing shade that tenants and employees actually value. It's the perfect foundation for EV charging stations, which are becoming a standard expectation for California commercial real estate. Just keep in mind that these aren't overnight projects. You'll want to review the commercial solar installation timeline to align your construction with your fiscal year goals. If you're ready to see the numbers for your specific site, you can request a professional energy cost saving analysis to map out your true savings potential.
Take Command of Your Operational Costs
The numbers don't lie, but they do hide. We've decoded the bill components and walked through the framework, but the real work starts when you stop treating energy as an uncontrollable overhead expense. When you decide to analyze my business energy consumption, you're reclaiming the massive portion of your bill that usually disappears into demand charges and TOU penalties. It's about shifting from a passive utility customer to an active manager of your own power.
SolarPorts Development focuses on these specific high-impact transitions for commercial owners who are tired of the status quo. We provide turnkey solutions for CA commercial real estate, specializing in the actual integration of BESS and solar carports to ensure your data translates directly into cash flow. Our process is built around small-scale commercial ROI, making sure every kilowatt saved is a win for your balance sheet.
Your interval data is already waiting in your portal. Get your data-driven energy cost saving analysis from SolarPorts Development and turn those unpredictable utility spikes into a manageable, strategic asset. You've done the research; now it's time to build the solution.
Frequently Asked Questions
How do I get my business's energy interval data in Northern California?
You can pull this directly from PG&E's online account portal using the "Green Button" tool. For properties in Northern California, this provides the 15-minute interval data required to see exactly when your building draws the most power. If you don't want to dig through the portal yourself, you can authorize a consultant to pull this usage history via PG&E's "Share My Data" platform. Having this granular record is the only way to identify the specific spikes that drive your costs.
What is the difference between an energy audit and an energy cost saving analysis?
An energy audit is a physical inspection of your equipment, but an energy cost saving analysis is a strategic financial review of your utility profile. When I analyze my business energy consumption, I'm not just looking for a leaky window; I'm looking for the fiscal justification for a BESS or rooftop solar. It's about finding the highest ROI by matching your usage patterns to the most favorable rate structures available in the current market.
Can analyzing my energy consumption help me qualify for California solar incentives?
Yes, accurate data is the foundation for almost every state and federal incentive available to Northern California businesses. Programs like the Self-Generation Incentive Program (SGIP) or specific PG&E efficiency rebates require verified usage profiles to determine your eligibility. Without a clear analysis, you're essentially leaving money on the table that could have offset the capital cost of your solar or battery infrastructure.
How much can a business realistically save by identifying peak demand spikes?
Savings vary, but identifying a single piece of heavy machinery that triggers a peak can often slash your demand charges by 20% or more. In many Northern California commercial zones, demand charges are calculated based on your highest 15-minute window of the month. If you can move that usage or "shave" it with a battery, you reset the price for the entire billing cycle. It's the most direct way to stop the utility from overcharging you for a brief surge.
More Articles

Sacramento Commercial Rooftop Solar: The 2026 Strategy for Property Owners

Commercial Solar Plus Storage ROI Under NEM 3.0: The Unfiltered 2026 Reality
