

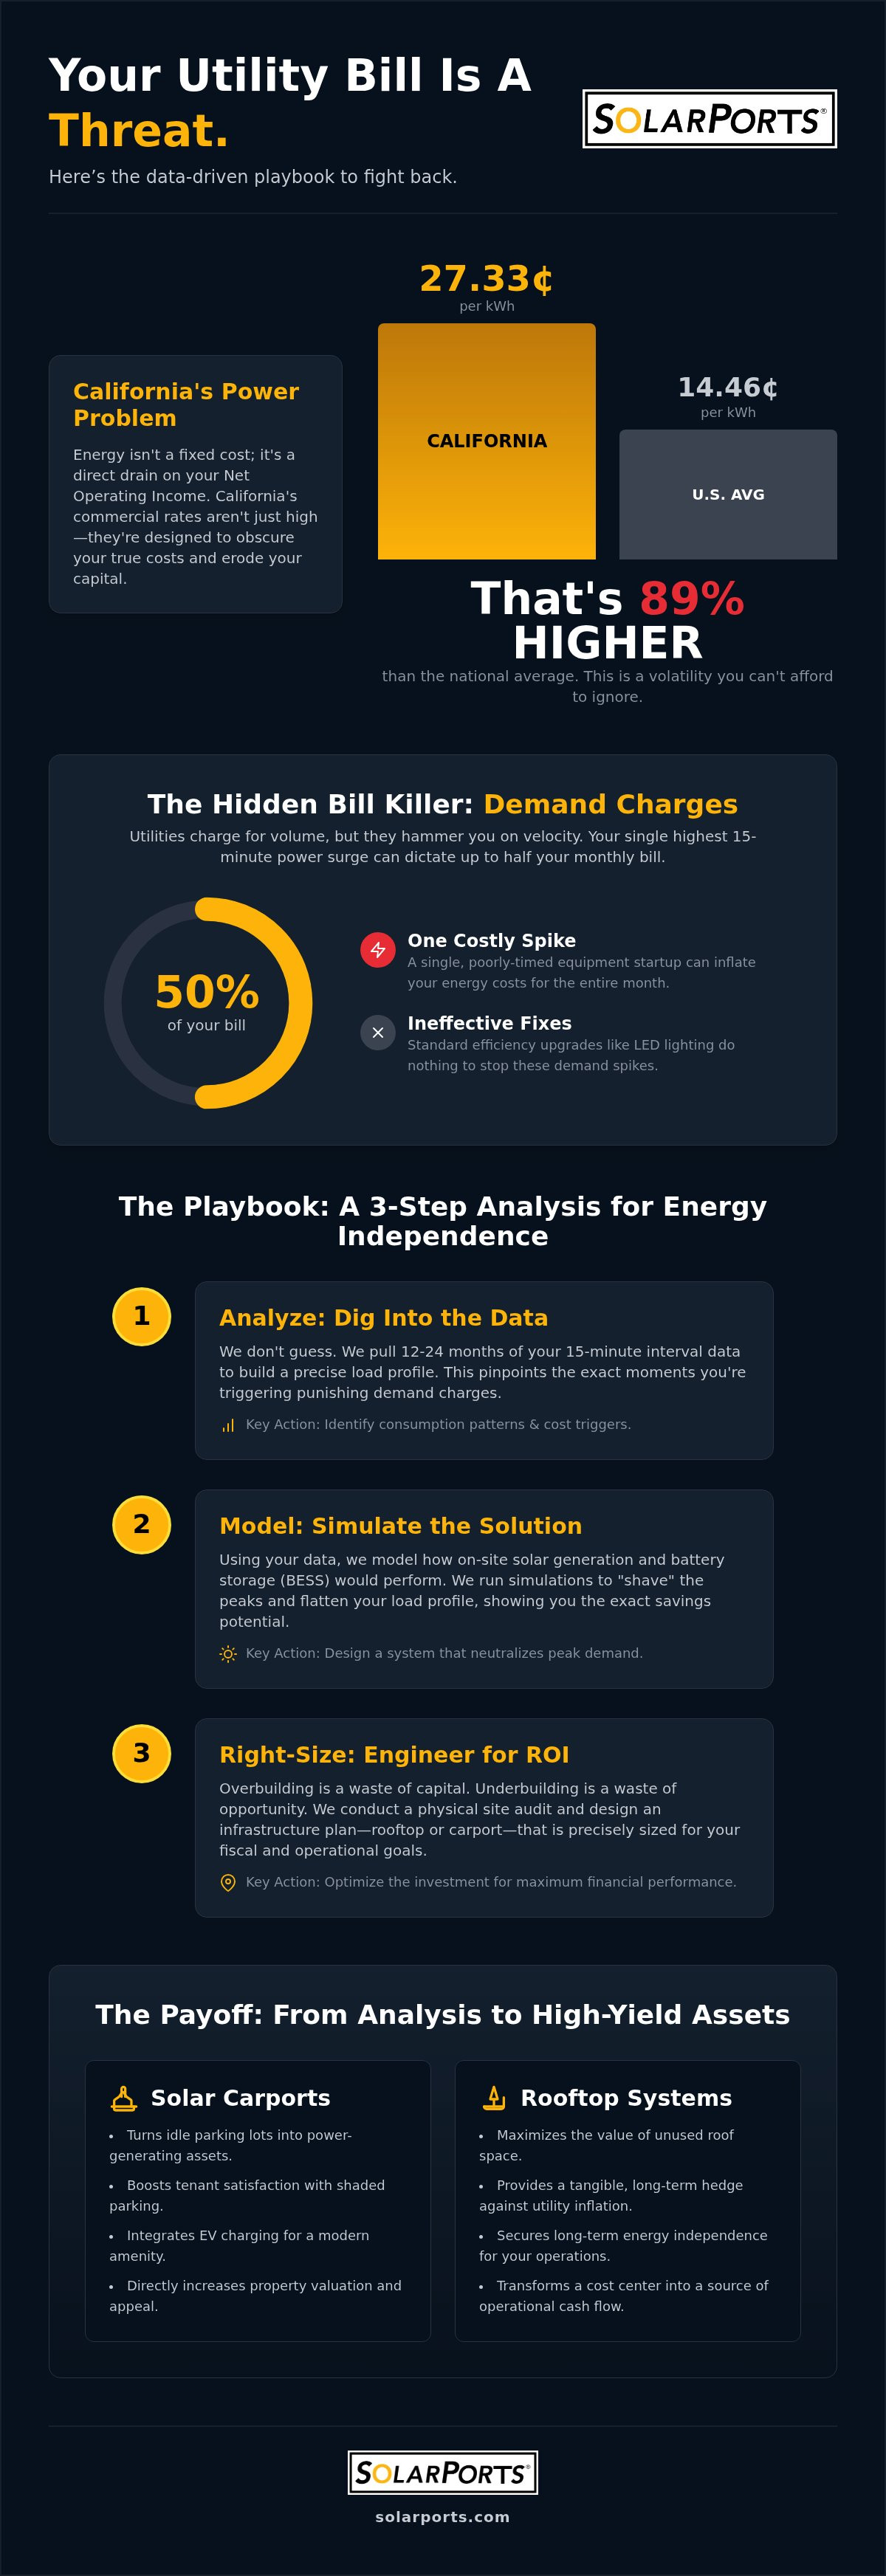
Electricity is no longer a fixed cost. California's commercial rates now average 27.33¢ per kilowatt-hour, which is 89% higher than the national average as of September 2026. You likely view your utility bill as an unavoidable tax on your operations, especially when peak-demand charges and NEM 3.0 complexities seem designed to obscure your true costs. Executing a professional commercial energy cost saving analysis California stakeholders can rely on is the only way to stop this erosion of your net operating income.
We'll show you how to dissect your billing data to identify high-ROI solar and storage opportunities that provide a definitive hedge against utility volatility. You'll learn to move past the skepticism of generic audits and toward a data-backed strategy for energy independence. This guide outlines a clear roadmap for reducing OpEx while simultaneously increasing your property's valuation through strategic, turnkey infrastructure investments.
Key Takeaways
- Identify the financial impact of demand charges, which often comprise 50% of a commercial utility bill, and learn the tactical methods to mitigate these costs.
- Execute a precise commercial energy cost saving analysis California asset managers need by utilizing 24 months of interval data to build an accurate load profile.
- Avoid the pitfalls of over-engineering by right-sizing your solar and BESS infrastructure to match your specific operational footprint and fiscal objectives.
- Transition from data analysis to turnkey deployment of solar carports and rooftop systems to secure long-term energy independence and enhanced property value.
Why California Utility Rates are a Strategic Threat to Commercial Assets
Energy costs are a direct threat to net operating income. California businesses currently face an average rate of 27.33¢/kWh, which is 89% higher than the national average as of September 2026. This disparity is not a temporary fluctuation. It's the outcome of systemic grid instability and mandatory wildfire mitigation investments that utilities pass directly to the ratepayer. Relying on passive utility management is a strategy for capital erosion. A rigorous commercial energy cost saving analysis California property owners conduct is the primary defense against these escalating operational expenses.
Compliance is the floor, not the ceiling. While the California Energy Code (Title 24) mandates basic efficiency, achieving true fiscal optimization requires looking beyond the minimum standards. You must identify where your building leaks cash during expensive peak utility windows. Implementing strategies to lower commercial electricity bills California businesses use can transform these liabilities into operational cash flow. Stop overpaying for power you could be generating on-site through localized infrastructure upgrades.
The Hidden Impact of Peak-Demand Charges
Utility companies don't just charge for volume; they charge for velocity. Demand charges often account for 30% to 50% of a commercial bill. These fees are calculated based on your single highest 15-minute window of usage during a billing cycle. One poorly timed HVAC start-up can set your rate for the entire month. Traditional efficiency measures like LED lighting often fail to address these spikes. You need a data-driven approach to flatten your load profile and protect your bottom line from aggressive tariff structures.
The Anatomy of a Strategic Commercial Energy Cost Saving Analysis
Precision is mandatory. A generic audit won't suffice when dealing with complex utility tariffs. A comprehensive commercial energy cost saving analysis California requires 12 to 24 months of 15-minute interval data, often referred to as Green Button data. This granular visibility allows us to identify the exact moments your facility triggers expensive demand charges. By reviewing the California Energy Consumption Dashboards, it's clear that commercial loads are becoming increasingly volatile and require sophisticated modeling to manage effectively.
Right-sizing is a financial imperative. Over-building a solar array leads to stranded capital and poor ROI. Conversely, under-building fails to eliminate the peak-demand spikes that drive up your monthly liabilities. A rigorous commercial energy cost saving analysis California owners utilize must evaluate physical assets like parking lot feasibility for solar carports and rooftop structural integrity. This physical audit confirms that your site can handle the weight of a rooftop system or the structural requirements of a carport. You can explore our turnkey services to see how we bridge the gap between data and deployment.
Three Steps to a Data-Driven Load Profile
We follow a methodical three-step process to ensure accuracy. First, we extract and clean utility interval data to visualize real-time consumption patterns. Second, we model solar generation against your specific Northern California footprint, whether on the roof or in the parking lot. Third, we simulate BESS discharge to "shave" peak loads, effectively lowering the building’s baseline cost. This process ensures your investment is optimized for fiscal performance. If you're ready to see your facility's potential, you can schedule a professional data review to begin the process.
From Analysis to Execution: Deploying High-ROI Infrastructure
Analysis is only valuable if it translates to the job site. Turnkey implementation ensures the precision of your initial commercial energy cost saving analysis California data isn't lost during the transition to construction. By moving directly from modeling to installation, you maintain momentum and fiscal accuracy throughout the project lifecycle. Explore our commercial solar services to see how we bridge the gap between digital data and structural steel.
Solar carports offer a dual-value proposition for properties with constrained roof space. They generate on-site power while increasing tenant satisfaction through shaded parking and integrated EV charging stations. This infrastructure upgrade directly impacts property valuation by transforming an idle parking lot into a high-yield energy asset. Unlike abstract policy shifts, physical hardware provides a tangible, long-term hedge against utility inflation.
Battery Energy Storage Systems (BESS) function as the operational brain of the entire energy system. They manage the grid-tie to ensure you never pay peak-demand rates by discharging stored energy during the most expensive utility windows. This strategic dispatch is essential for meeting California's Building Energy Efficiency Standards while simultaneously protecting your operational bottom line from tariff volatility.
Integrating Solar Carports and BESS for Maximum Impact
Carports are the preferred solution for small-scale commercial sites across California. They bypass the structural limitations of aging rooftops and utilize underperforming asphalt assets to create new revenue streams. Our turnkey project management navigates the complex permitting and interconnection landscape, ensuring your project clears every regulatory hurdle without operational delays. Ready to see the numbers for your property? Book your free solar consultation to review your data-backed roadmap.
Securing Your Asset’s Operational Future through Data-Driven Infrastructure
Utility volatility is a structural reality for California property owners. You can't afford to treat energy as a passive expense. By leveraging 24 months of interval data, a precision-led commercial energy cost saving analysis California stakeholders utilize identifies hidden inefficiencies and demand-charge triggers. This analytical approach ensures your BESS and solar carport installations are right-sized for maximum ROI rather than over-engineered for wasted capital.
SolarPorts Development specializes exclusively in the California commercial real estate market. We provide the turnkey project management and ROI modeling necessary to bridge the gap between complex utility data and operational cash flow. Don't let aging infrastructure erode your property's valuation. Schedule your free 2026 commercial solar and energy cost saving consultation today to lock in your roadmap for energy independence. It's time to transform your utility bill from a strategic threat into a competitive advantage.
Frequently Asked Questions
What is the difference between a standard energy audit and a commercial energy cost saving analysis?
A standard audit typically identifies passive efficiency gains like lighting or insulation. In contrast, a commercial energy cost saving analysis California asset managers require focuses on peak-demand mitigation and tariff optimization. We utilize 15-minute interval data to model the exact velocity of your consumption. This precision allows for the right-sizing of BESS and solar carports to target your most expensive utility windows.
How much can a California business typically save with a BESS and solar carport combination?
Savings depend on your specific load profile, but this combination targets both energy volume and aggressive demand charges. In Northern California, demand fees can account for half of your total bill. By deploying a BESS to shave these peaks and carports to generate on-site power, you're building a structural hedge against utility inflation. We prioritize fiscal performance over mere engineering specs.
What data do I need to provide for a comprehensive energy analysis?
You'll need to provide 12 to 24 months of 15-minute interval data, often called Green Button data, from your utility portal. We also require a full year of utility statements to analyze your current tariff structure and demand charge history. This granular data allows us to simulate how on-site generation and storage will interact with your building's unique operational footprint.
Does the analysis account for current California solar incentives and tax credits?
Our analysis integrates all applicable 2026 financial levers, including the 30% Federal Investment Tax Credit and the Self-Generation Incentive Program (SGIP). We also factor in MACRS accelerated depreciation to provide a comprehensive view of your net investment. These incentives are essential for accurately modeling your project's internal rate of return and long-term impact on your operational cash flow.


